The prior post suggested the subject experienced a diminished exposure to solar UV radiation due to his maintaining a work schedule that precluded, or greatly reduced, his daily exposure to solar UV radiation.
The primary thesis being explored in this series of posts is the potential for a reduction in UV exposure to moderate, or significantly reduce, the ability of the pineal gland to engage in “producing sulfate, and that the sulfate, conjugated to melatonin, is distributed throughout the brain via the CSF [cerebral spinal fluid] .” Sulfate is understood to have a role in the creation of “structured water” which offers a critical neuro-protective benefit through “buffering the brain against physical impact, and in degrading and recycling damaged proteins and mitochondria.”
The immediate question to be answered is: “to what degree may the findings in respect of a single subject be generalized to a larger population of mTBI victims?” What number of other Canadian citizens may be exposed to similar risk due to an insufficient exposure to solar UV radiation?
The following charts are derived from a UV Index Calculator maintained by Environment Canada. The calculator permits the creation of a UV Index chart for any specified calendar date and any geographic location. The chart found at the above URL is set to exhibit the latitude and longitude for Ottawa, Ontario. Clicking on the chart image area permits the creation of a new chart for the day specified. This UV Index Calculator was used to create three daily index charts for the following days: January 1st; February 1st; March 1st. These UV Index charts are presented below.
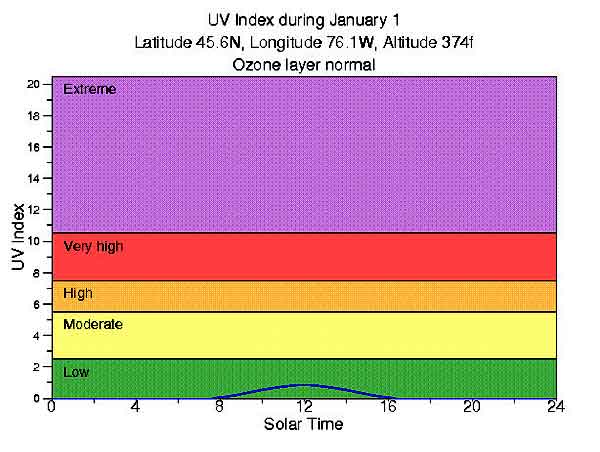
Figure 1 – January 1st UV Index data
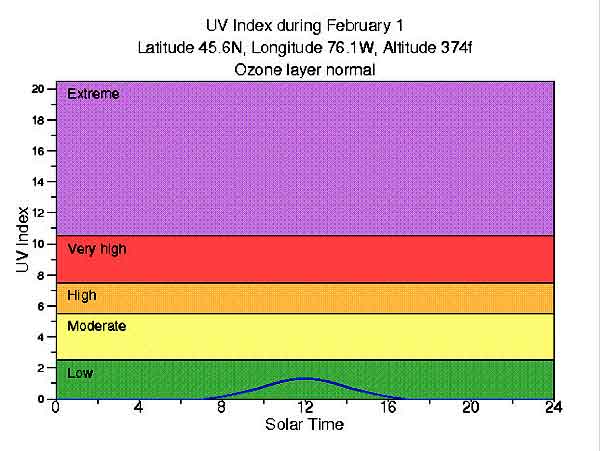
Figure 2 – February 1st UV Index data
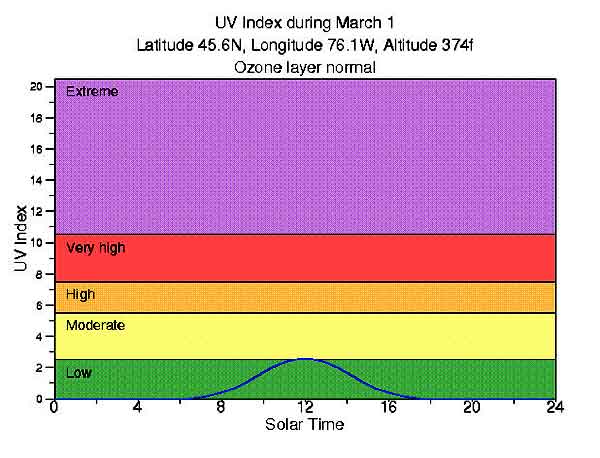
Figure 3 – March 1st UV Index data
It is immediately evident that the UV Index remains low throughout the period under discussion. The UV index only begins to emerge from the band of low exposure in the first days of March and this only at solar noon (During the period of daylight savings the solar noon occurs one hour behind noon of the daylight savings time clock).
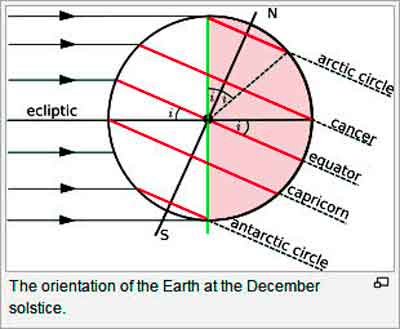
Figure 4 – Seasonal Change in the Angle of Incidence
This reduction in UV exposure is primarily explained by the change in the angle of incidence of all solar radiation between the winter and summer photo-periods. During the winter photo-period all solar radiation strikes 45 North latitude at an angle of incidence close to 45 degrees. See the angle of incidence of the Tropic of Cancer in Figure 4 above. During the northern hemisphere summer, the angle of incidence is close to 90 degrees. Figure 4 shows solar radiation travelling along the plane of the ecliptic striking south latitudes (the Tropic of Capricorn) at a 90 degree angle of incidence during the northern hemisphere winter. This is detailed in Figure 5 below.

Figure 5 – Solar Radiation Angle of Incidence
It can be seen that in the northern hemisphere summer photo-period, the angle of incidence is approximately 90 degrees to the surface of the earth. During the northern hemisphere winter photo-period the angle of incidence is approximately 45 degrees to the surface of the earth.
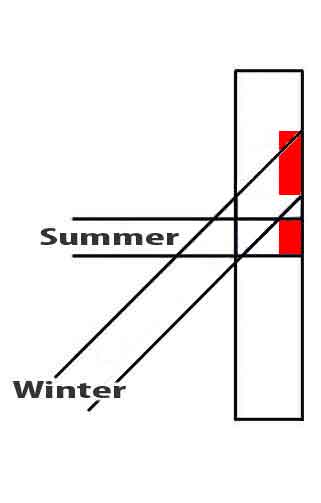
Figure 6 – Area of Dispersion
If solar radiation is maintained as a constant, then the change in the angle of incidence will result in a significant alteration in the area of the earth exposed to that radiation. When the sun is at a 90 degree angle of incidence during the summer photo-period, the radiation constant will be distributed over the area shown by the height of the lower red rectangle in Figure 5 . This is considerably less than the same irradiated area during the winter photo-period (the height of the upper red rectangle. Note that Figure 6 presents a side elevation. A more accurate depiction would utilize a plan view. This would better illustrate the fact winter UV radiation spreads to cover an area approximately four times the area illuminated by summer UV radiation). The seasonal alteration in the angle of incidence results in a constant amount of solar UV radiation being dispersed over a greater surface area during northern hemisphere winter. This results in greatly reduced exposure to all solar radiation, including UV radiation.
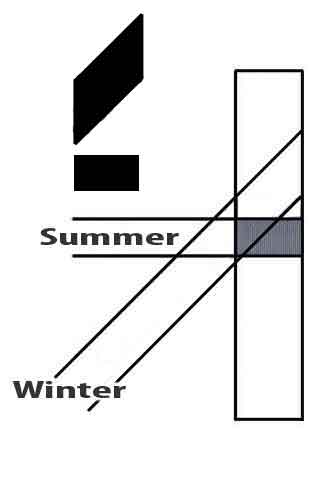
Figure 7 – Atmospheric Volume
When the angle of incidence changes, there will be a corresponding increase, or decrease, in the atmospheric volume through which the solar radiation must pass. The presence of ozone in the upper atmosphere serves to screen the earth from UV radiation. The greater the volume of atmosphere through which the solar radiation must pass, the greater the attenuation of solar UV. The shapes in the upper left of Figure 6 are sized to represent the differing atmospheric volume between summer (lower rectangle) and winter (upper parallelogram). The amount of atmospheric ozone will differ depending on the observer’s location on the earth`s surface and it can alter from day to day by up to 25%. In high northern latitudes adjacent to the polar ozone holes, the ozone may be decreased by up to 70%.
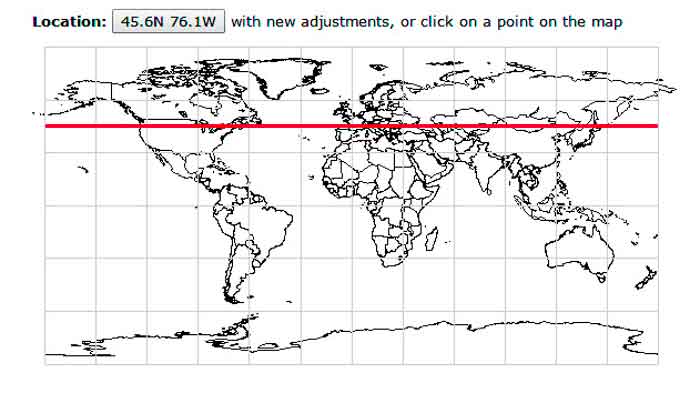
Figure 8 – 45 North Latitude
Figure 8 presents an image of the globe with a red line drawn through 45 North latitude. It is clear that the majority of the Canadian land mass will experience greatly reduced UV radiation during the winter photo-period. The same will be true for much of Northern Europe, and the entire land mass of Russia.

Figure 9 – 45 North and South Latitude
Figure 9 presents a global heat map representing the cumulative full year UV index. Areas coloured purple have the greatest degree of annual UV exposure and areas coloured navy blue have the least amount of annual UV exposure. Figure 9 again demonstrates that most of the landmass of Canada, Northern Europe, and Russia, experience low degrees of annual UV exposure.
This image suggests a hypothesis. Inspection shows relatively few areas of human habitation in the low Southern latitudes. The sole exception is the south island of New Zealand. If the PCS Thesis is correct, then it is hypothesized that New Zealand will demonstrate an incidence of mTBI per 1,000 population that is significantly greater than that found in either Columbia, Chile, or Indonesia.
The problem with this hypothesis is that the global south may exhibit a reduced degree of automotive ownership (a significant cause of mTBI), a possible lower standard of medical care (greater reliance on home clinics and remedies, less access to medical facilities), an insufficient formal reporting structure (what injury does occur is not correctly recorded and the statistical validity of reporting is poor), and less time for organized field sports (little relief from a full day of manual labour) than is to be found in the Industrial north. These confounding factors would need to be addressed in seeking to confirm this hypothesis.
—————————————
Note
The header image displays the illumination found on January 6th, 2015 at 1355 hours.
Posts in the PCS Sequence
PCS Thesis – Index
PCS Thesis – The Accident
PCS Thesis – Injury Modalities
PCS Thesis – The Pineal Gland
PCS Thesis – UV Index
